How to use DevTools for Digital Analytics
Tagging and debugging can be a daunting task for a Digital Analyst just starting out in the world of data – there’s so much to learn it sometimes feels like an impossible task.
But there is a saviour in sight! Something that will open up a world of possibilities to you is DevTools.
Pressing F12 on any webpage and you officially thrown back the curtain on the webpage in a way that “View Page Source” just can’t compete with.
So, if you want to find out how to make your life infinitely easier, then read on and find out some of my favourite features – and a couple of things I wish I had known back when I was getting started.
Make use of Extensions
The first tip I would give to you is if an extension is going to make your life easier, you might as well install it. I wrote an entire blog post about extensions for digital analysts which is a good starting point if you are brand new to DevTools and want to get started with debugging right away.
Learn how to use CSS Selectors
When you use Google Tag Manager (GTM) to make tags or variables you will see matching options such as “matches CSS Selector” but you may have never used them.
Using CSS Selectors in GTM means you can be specific about the element interacted with, or the data captured by GTM. Learning how to leverage these is incredibly valuable and will help you navigate the DevTools Element’s tab with ease
There is too much to cover in this blog post alone, the below is a good way to get started:
| Selector Type | Selector Notation | Example | Notes |
| Element Name | The element name | H1, H2, div, span, a | Selects all elements of this type (e.g. all H2 elements) |
| Class | . | .red-button | Selects everything with the specified class |
| ID | # | #form-submit-button | Selects the element with the matching ID. |
| Parent-Child relationship | > | div > H2 | Allows to specify elements that are in a parent-child relationship. |
| Other Attribute | [] | [author] | Allows any attribute to be selected |
| Specific Attribute | [attribute=”specific”] | [author=”emma”] | Returns any elements with a specific attribute |
CSS Selectors can be combined together for example div.content > H2 selects all H2 elements within any div with the class “content”.
Another example would be p[author=”emma”] selects any paragraph element that contains the author attribute where author is equal to ”emma”.
Please note that Google Tag Manager will return the first instance of the element that matches the CSS selector on page – if you are using DevTools all elements are selected.
You can find a full list of CSS Selector References at W3 Schools.
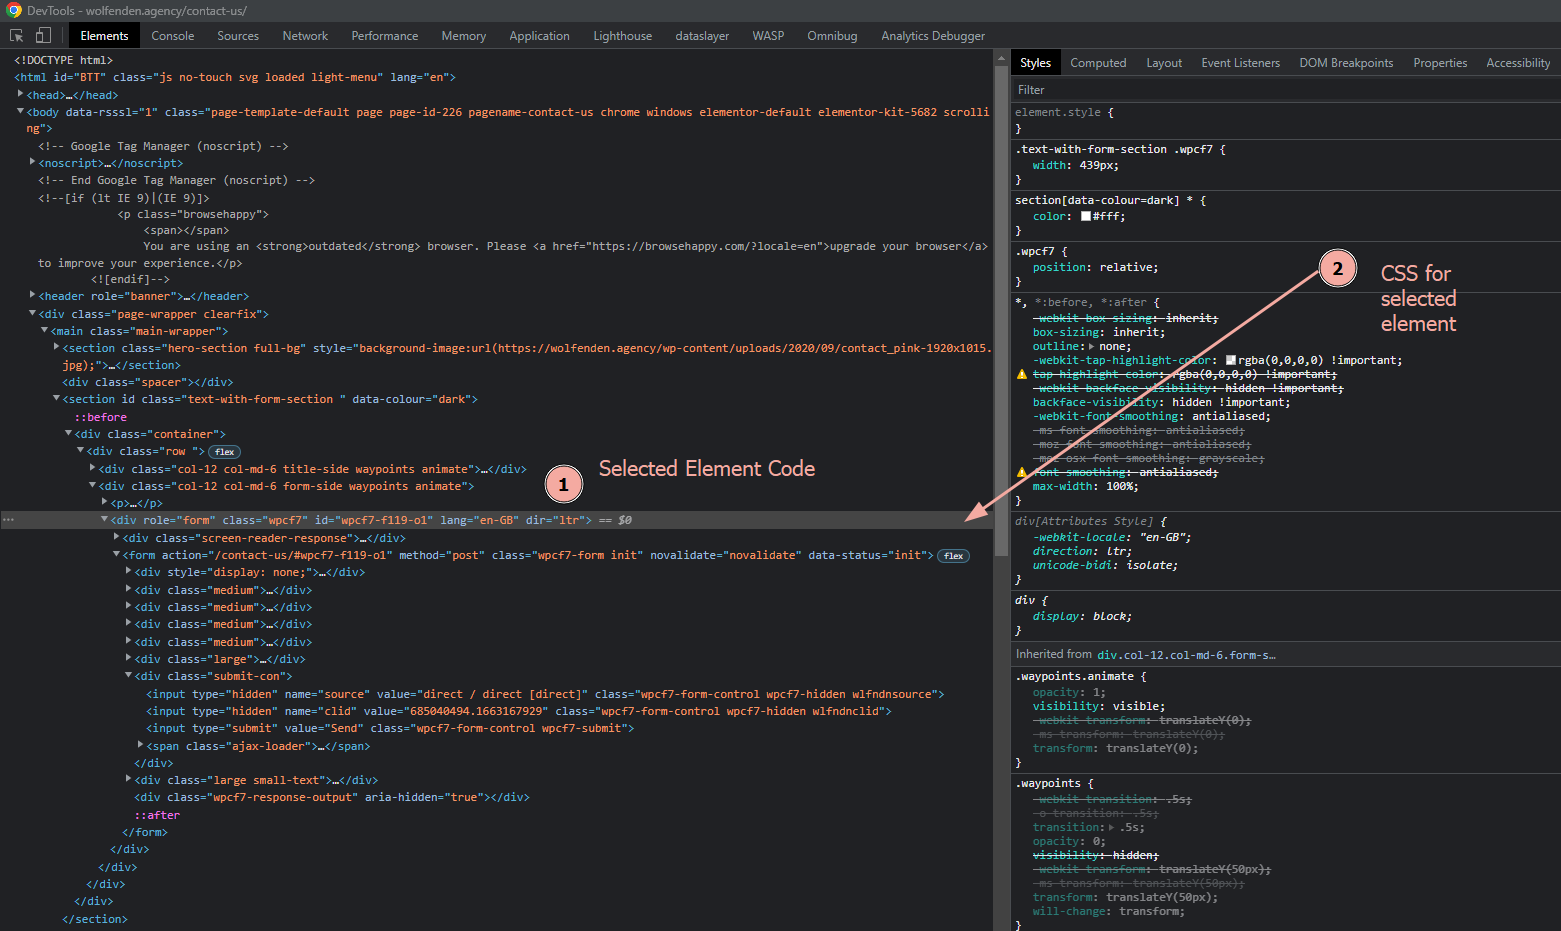
Element Selector
If you look at the top-left of your DevTools window, you will see two icons: one looks like a mouse cursor. If you click it, and return to the web page you are inspecting, you can now select any element on page and information is displayed about it.
You can either view this on the page itself of within the Elements tab. This is effectively the same as right clicking and selecting “Inspect Element”.
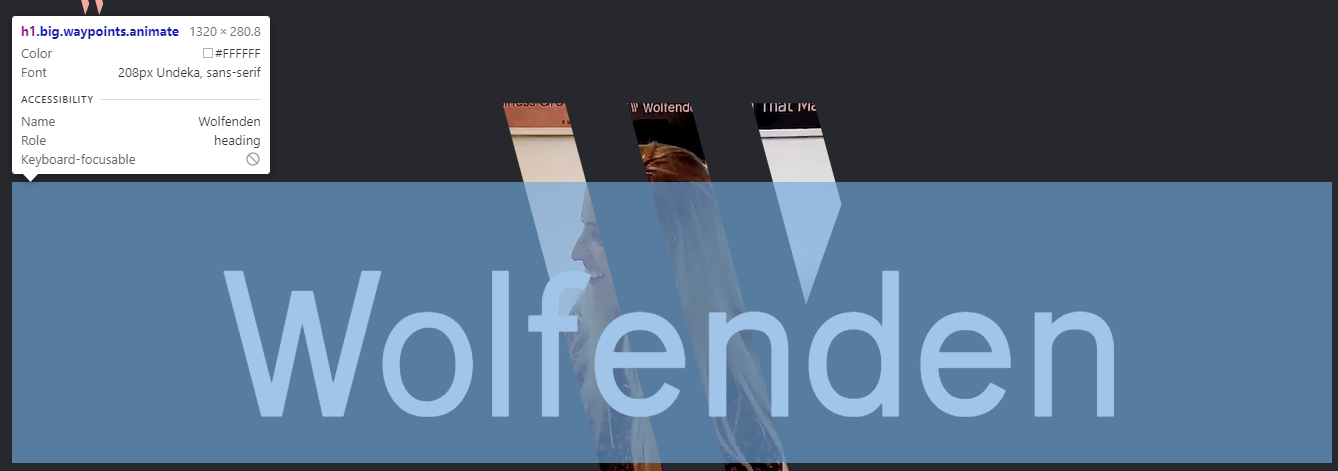
This can be useful to quickly identify information about a particular element on the page.
The reverse is true as well: if you are testing or debugging a Google Tag Manager container, for example, it may contain references to a specific element within a trigger for example. You can use the element selector to understand whether the element referenced in GTM is the same element as exists on page.
Some browsers allow you to paste the CSS Selector into the search box on the elements / inspector pane, which highlight any instances of the element on page.
Toggle Devices
Right next to the Element Selector in the top-left of your DevTools window there is another icon that looks like a mobile phone and a tablet computer. Click it and return to the website you are inspecting.
You will see that the website has now changed from fullscreen mode to a mode that emulates a mobile device, as well as user agent (and treats mouse actions as touch actions where relevant).
You can select the type of device as well as the orientation (by clicking the “rotate” button to the right-hand side) or the amount of throttling in place.
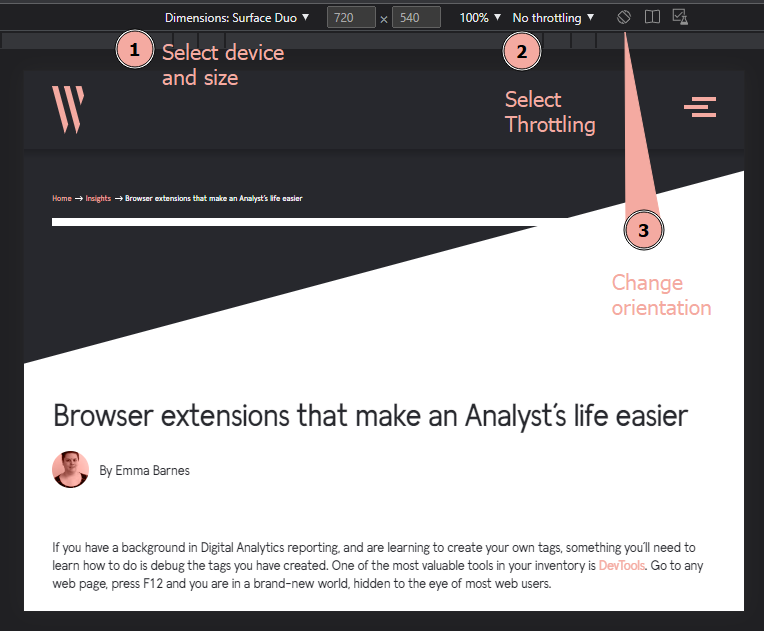
This can be useful to understand how a website functions on a mobile device. As well as understanding how the website looks on mobile, it can be used to determine if there are any tracking points that differ – for example are any pop-ups appearing where they shouldn’t, is there a different form that needs tracking.
Quick Mock-Ups
If you’re handy with code, but less handy with image editing software, DevTools become a really useful tool to create quick website mock-ups, especially to showcase small changes.
These changes are not permanent, only you can see them within your browser. This allows you to quickly change how a page looks to you and take a screenshot of the desired result.
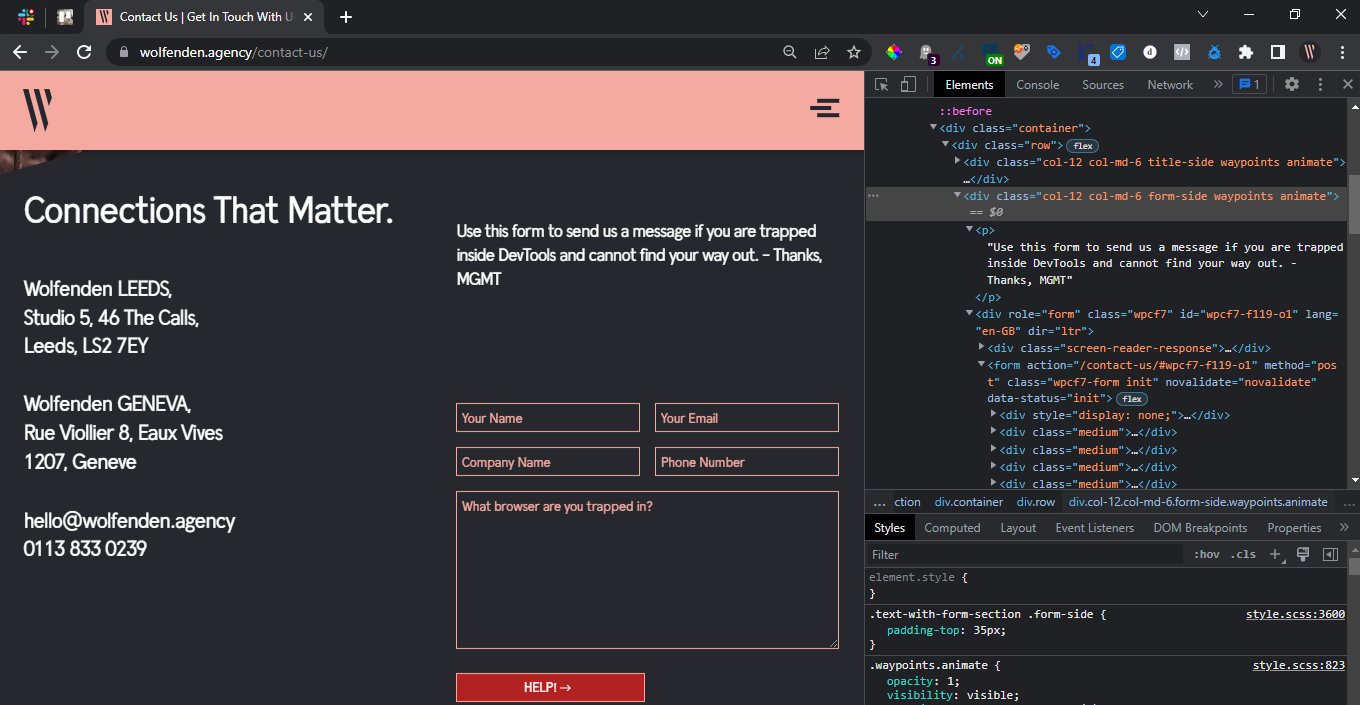
Image: Obviously a very real version of the contact us page
This can be used as a way to present variant test ideas for CRO, without having to open PhotoShop (or MS Paint!), before you build tests within your testing platform of choice.
Make the console easier to read
Open up the website you want to debug. Inside DevTools, open the Console tab (#1 in image below). As you interact with the website you will see the console change to reflect the different states of the website.
It can be a little overwhelming (especially if you have additional plugins installed) but there are a few things that can make it easier to understand.
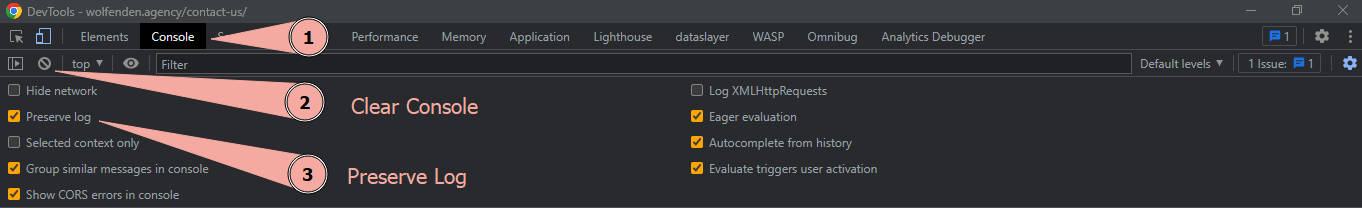
The first is “Preserve Log” – this is a setting that sits at the top of the console.
Enabling this allows you to see the information you had about the previous pages on the website, as by default the console log is cleared as you navigate to a new page.
The second is the ability to filter the console messages. You can do this just above the settings at the top. This allows you to filter for specific types of messages within the console.
This can be helpful in conjunction with plugins to allow you to search for things like data layer pushes.
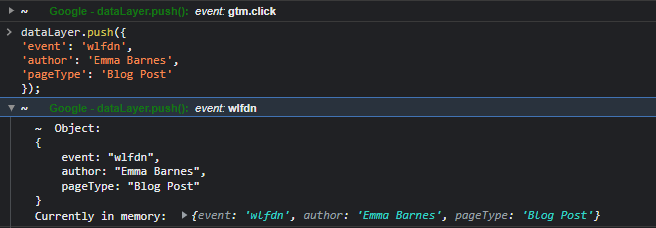
If want to display the current values of the data layer, you can do this in the console itself by typing dataLayer into the command line at the bottom (where the “>” is).
It does show you the data layer object, however it is not the easiest to read. Something that might make this easier for you to read is using the command console.table(dataLayer); instead.
JavaScript testing
Within the field of digital analytics you will encounter JavaScript, from using custom JavaScript to create variables to using data layer pushes to send events.
If you use the Console tab of DevTools, you can use the working space at the bottom to test your JavaScript.
I mostly use this feature to test out data layer pushes in conjunction with Google Tag Manager’s debug mode to see ensure my tags that fire on certain events are being send the correct data layer variables.
One handy piece of advice when using the console for running scripts is that you can press the “up” key to retrieve the last piece of code that was manually executed within the console.
Using the Network Tab
If you click the Network tab, much like the Console tab this will feel like you’ve opened up the Matrix.
What you are seeing is a list of requests made by the webpage including scripts that have been executed or files that need to be loaded by the web page.
There are a lot of things to cover here so some of my favourite tips are:
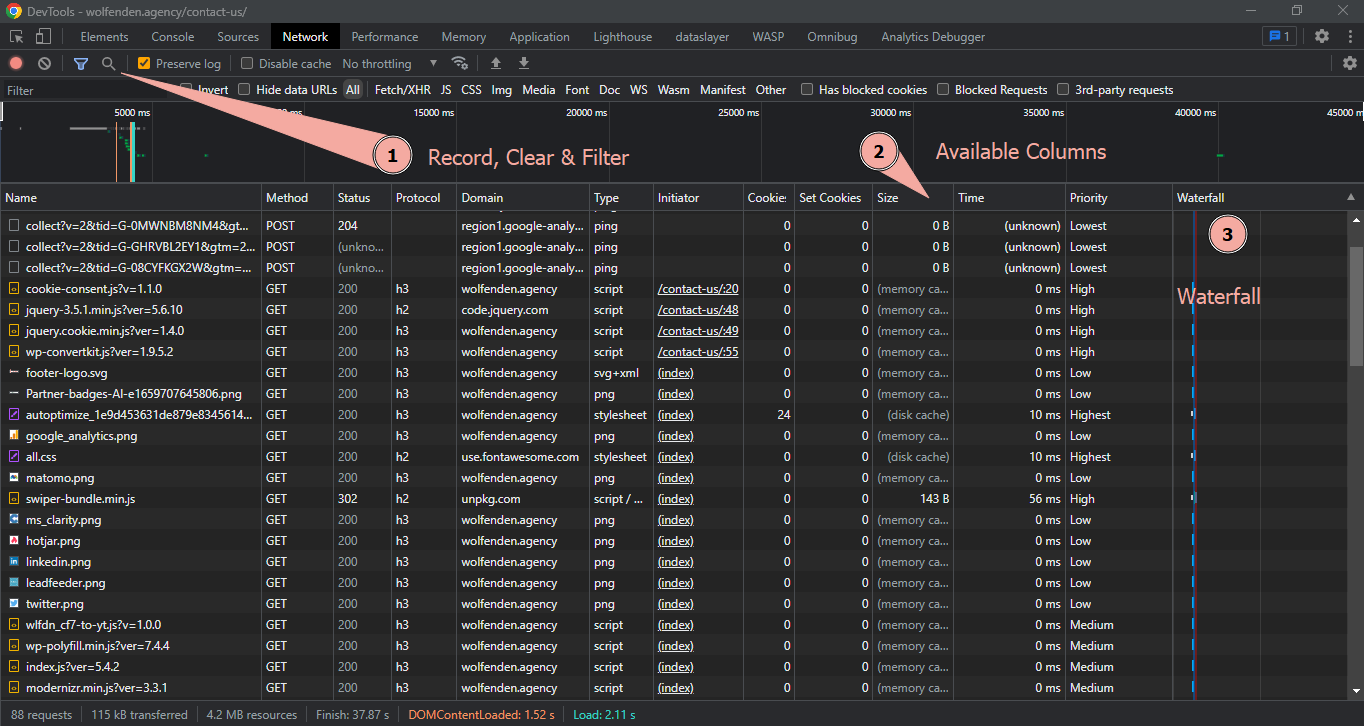
1. Use the record button to start and stop logging to the network tab, preventing new requests appearing within the list whilst you’re debugging.
2.Use the clear button to remove all previous requests from the log, making it easier to read new interactions as they occur.
3. Pressing F5 within any tab in DevTools reloads the page in the background and shows you all the requests that have been made since the initial page request.
4. Use the Filter box to find a specific request or use the filter buttons to find a specific type. For example filtering for “collect” will show you all the requests that have executed in relation to Google Analytics. Specifically “collect?v=1” filters for GA3 and “collect?v=2” filters for GA4.
5. Right Click the header row of the request table and it will show you a lot of columns you can enable or disable. Use this to show the ones that are most useful to you – for example “Domain”.
6. Using the Waterfall feature to understand when a request was made in relation to other requests, and how long the request was scheduled for, when the connection started, if it stalled, when the request was sent, how long the server took to respond and more.
7. Click into any request to see more details about it, including the payload that is being sent from the current page, the cookies set by the server response, information such as a redirect request, or the stack trace that allows you to see what JavaScript was called to trigger the request.
Reading Cookies and Local Storage
Open up the tab called Application in Chrome or Storage in Firefox – at the left hand side you will see a lot of options, but my most used one is “Storage > Cookies”. Click it and you will see a list of 1st and 3rd party cookies set on the web page you’re visiting. If you right click, you can use the “Clear” option to delete those cookies from your browser – you can also do this by hovering over the individual cookie and deleting it.
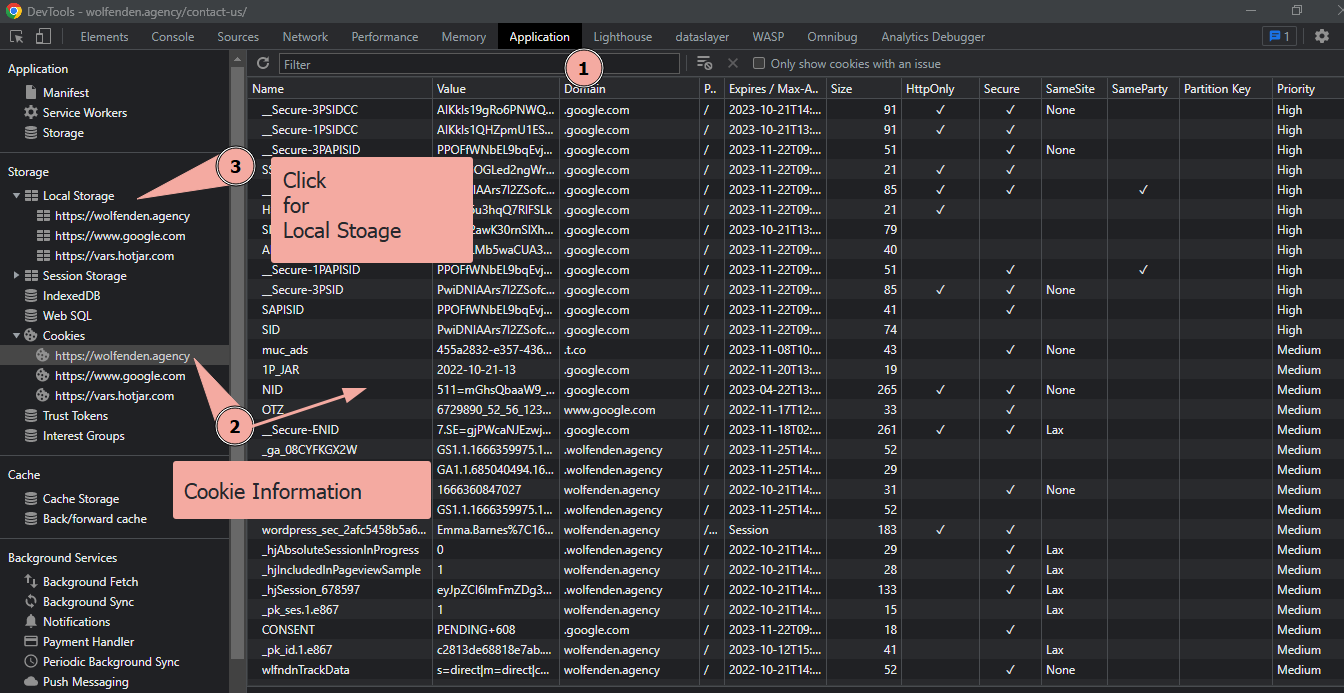
There is a table that allows you to see details about each cookie storing including its name, current value, what and when it is due to expire.
This can be useful when building a list of cookies for a cookie consent policy, or for utilizing within Google Tag Manager.
The Local Storage sub-menu shows Key-Value pairs for the domain you are on. These are pieces of information is stored in the browser itself, and is persistent when a session is closed.
Some consent systems store information as key-value pairs in local storage, rather than as cookies, which is where this section can become useful.
Closing
This blog post by no means covers everything that can be useful to a digital analyst, these are just some of my most-used features.
I hope that made your foray into DevTools a little less intimidating and if you’re a seasoned DevTool user, perhaps you learned something new! If you need any more help understanding the intricacies of DevTools and how to use them for your business then don’t hesitate to get in touch.
Latest Insights From The Team.
Explore our team’s latest thoughts and actionable advice from our blog to support your digital marketing strategies.