6 reasons you need to be using Explorations in GA4
Clickbait titles aside, if you’re using Google Analytics 4 (GA4) but haven’t started to use Explorations, you should start today. Here are six reasons why.
Reason 1: 🗝️ Unlock your custom data
If you’re collecting custom definitions, like custom dimensions and metrics, by default they aren’t going to show up in your GA4 reporting. In the reporting section, you can use secondary dimensions to see some of your custom data but you won’t be able to see more than one custom dimension at a time, and it may not be in a useful way. Using Explorations you can easily visualise that data in the way you want it.
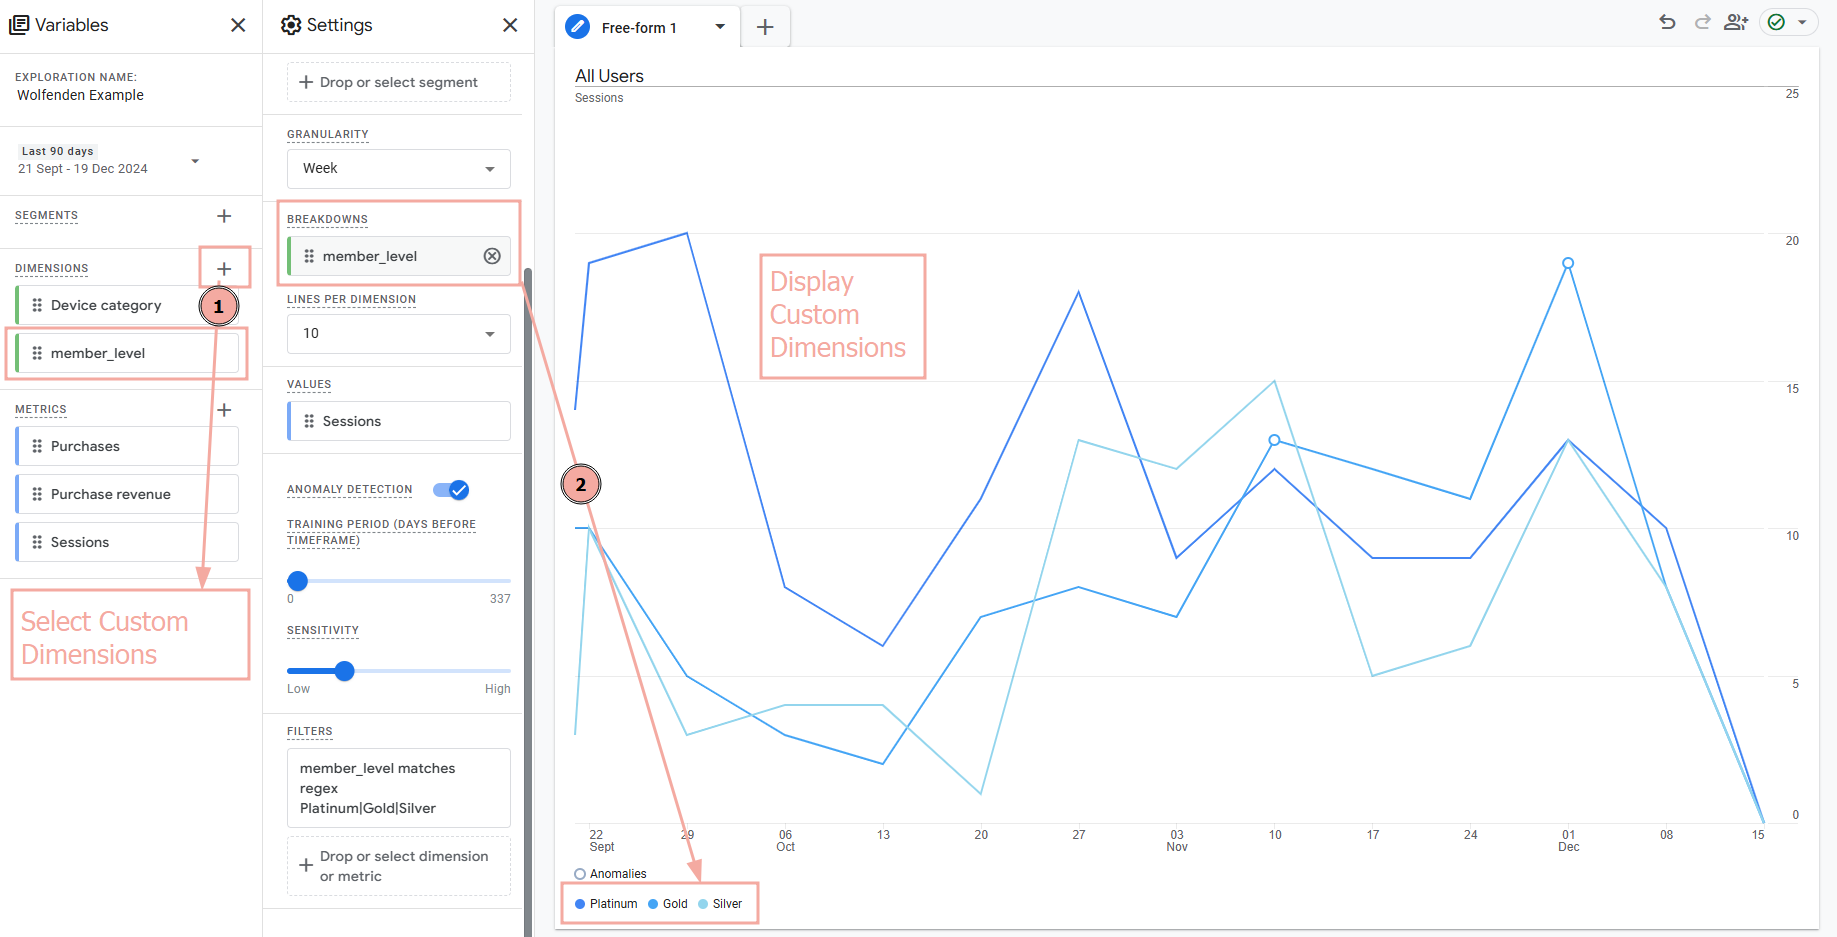
For example, if you’re capturing a custom dimension called “Transaction Type” you can select it from the dimensions in the dimension list, and then apply it as a breakdown or row within an Exploration. Combining that dimension with other dimensions and metrics can help you quickly visualise your newly-collected data.
Reason 2: 🔭 Funnel vision
Remember funnels and reverse goal paths from GA3 (Universal Analytics)? They’re back and better in GA4, but this time they are hidden inside Explorations.
A Funnel Exploration is a path that you expect a user to take (e.g. moving through a checkout, or progressing through a form), where a Path Exploration shows the natural paths users take through your website.
The best thing about using these Exploration types in GA4 is your paths are no longer limited by page view to page view. When building a Funnel or Path Exploration, you can choose to explore using either page views or events (page_view being a type of event).
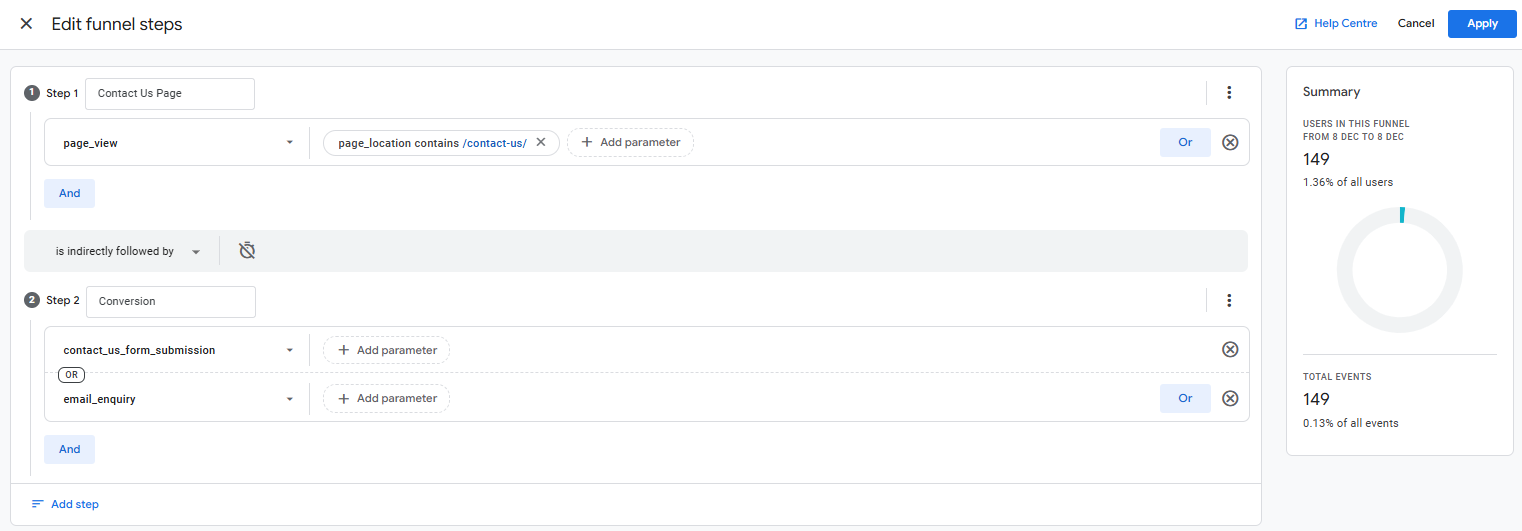
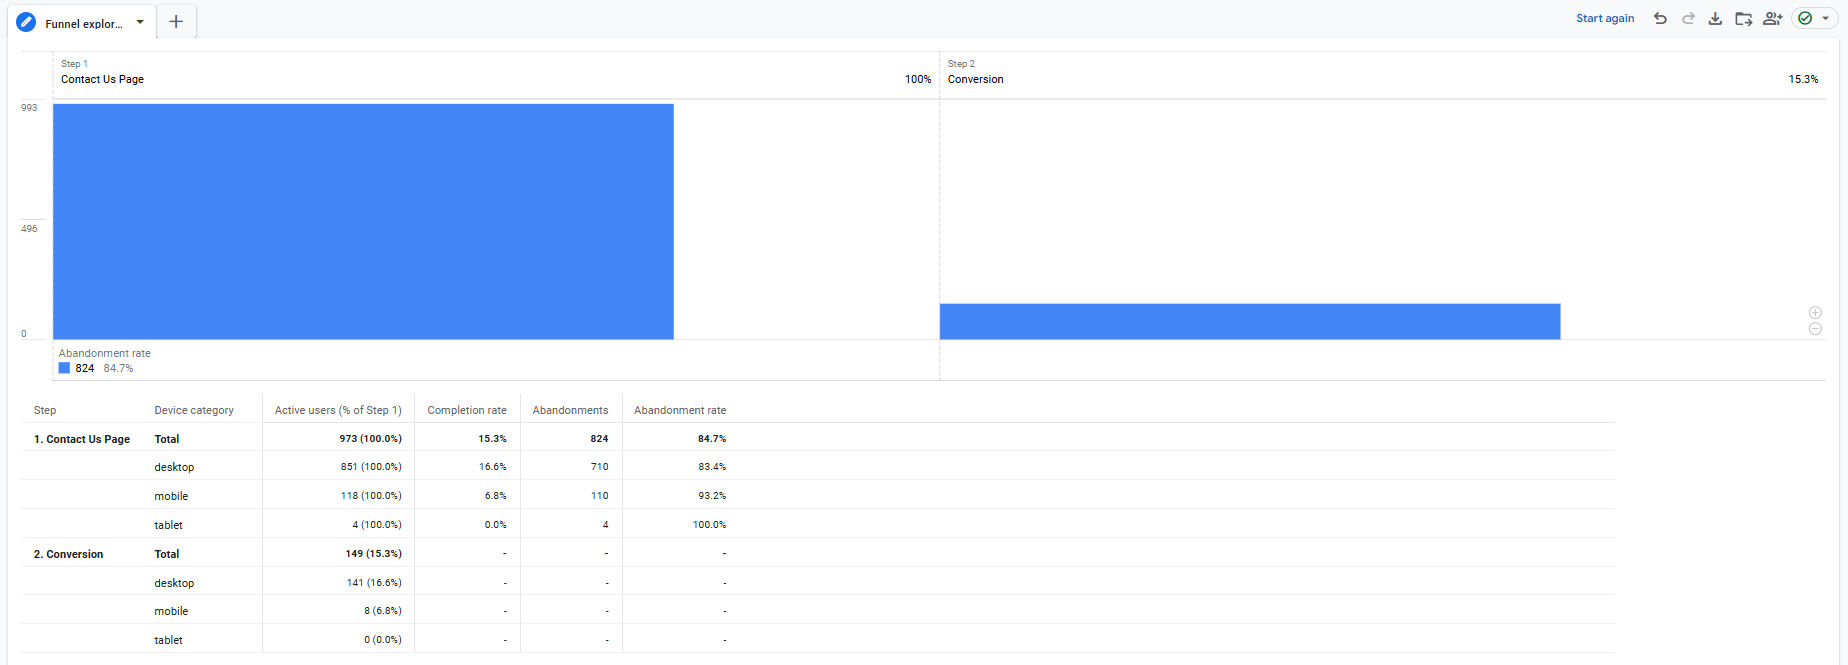
The above shows a very simple funnel showing the completion rate of conversions on the Contact Us page – but you can go as in-depth as you need.
Reason 3: 🥅 READY SET GOAL!
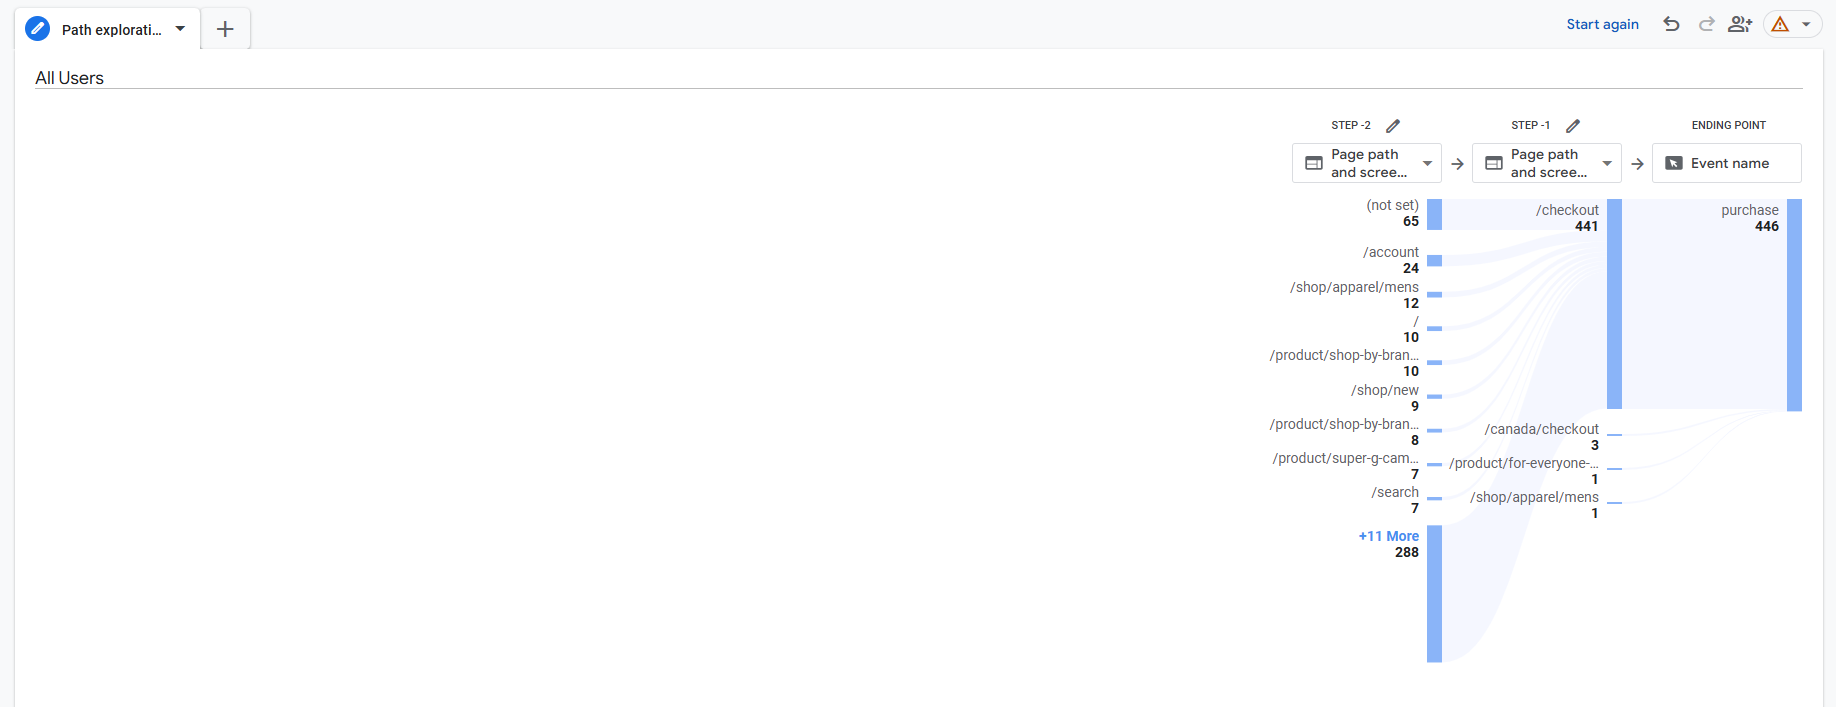
If you want to understand what users were doing just before they converted you may consider a reverse goal path. This can be achieved using the “Path Exploration” that was shown in Step 2. When you start a Path Exploration, the default view shows user process from the session_start onwards.
Each node in a page exploration shows a step a user takes – either a page or an event. You can change your node types from “Event” to “Page”, depending on what you find the most useful. You can also add more steps by clicking “more” or the appropriate node to expand it.
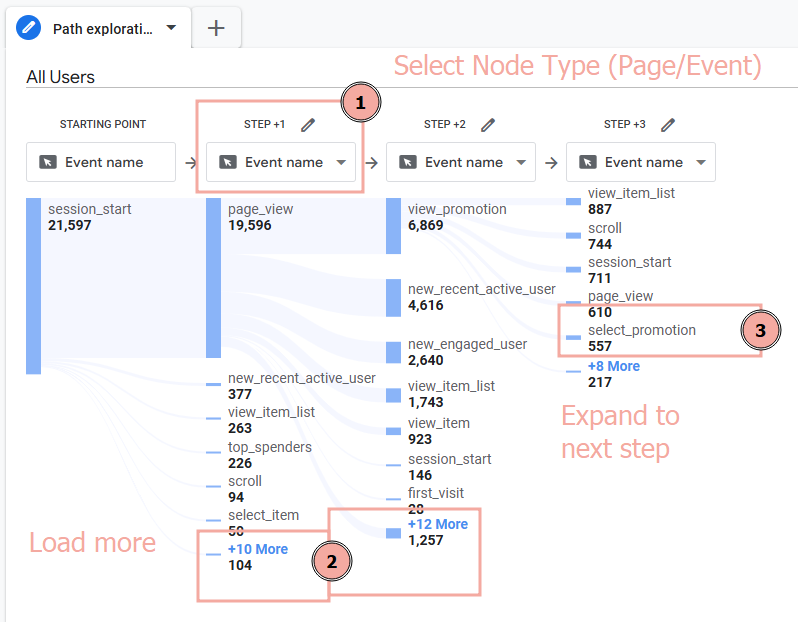
To understand what users were doing before they completed a key event, you need to click the button that says “Start Again“. You’re then offered to choose a Starting Point or an Ending Point. Select “Ending point“.


You can then choose a relevant event or page as an Ending Point and using this to explore the paths that lead to this end point.
Reason 4: 🧩 Segmentation
A very powerful aspect of GA4 Explorations is the ability to create and apply Segments. Segments are a way to group users together based on their similar properties or actions on site.
Segments can be as simple as “desktop users only” to much more complex users groups such as “Users who viewed this campaign and who viewed a specific page but did not convert: but only on mobile”. Segments are much more configurable than the Comparisons and Filters that exist within GA4 Reports.
Not only can you view the data associated with a particular group of users, this segment can be saved at Property Level, or set up as an audience for use with Google Ads.
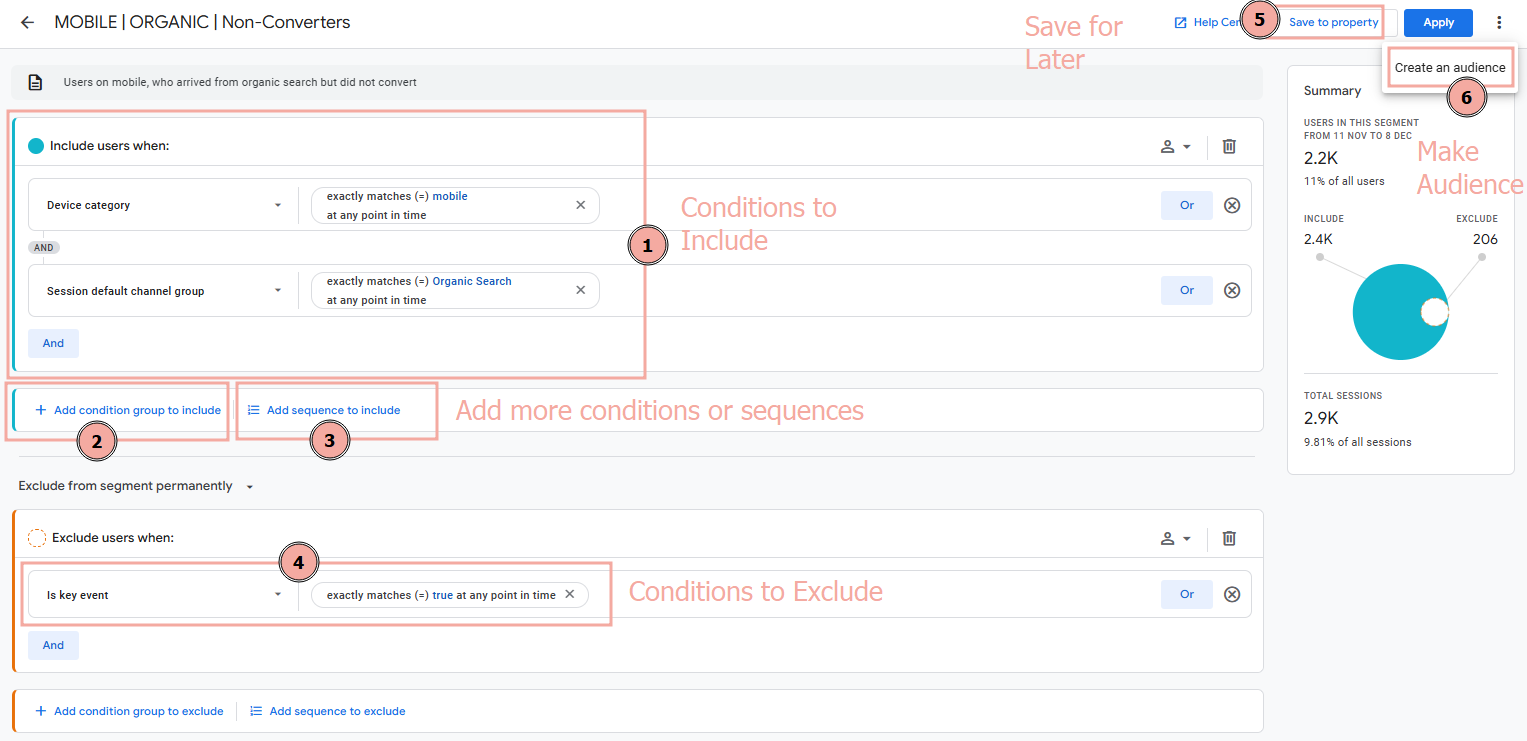
Creating segments can help you drill down into a subset of users or they can be compared to users within other segments to understand behavioural differences. One great method is to use sequencing similar to funnel steps, but it allows you to identify a user who took particular actions on site.
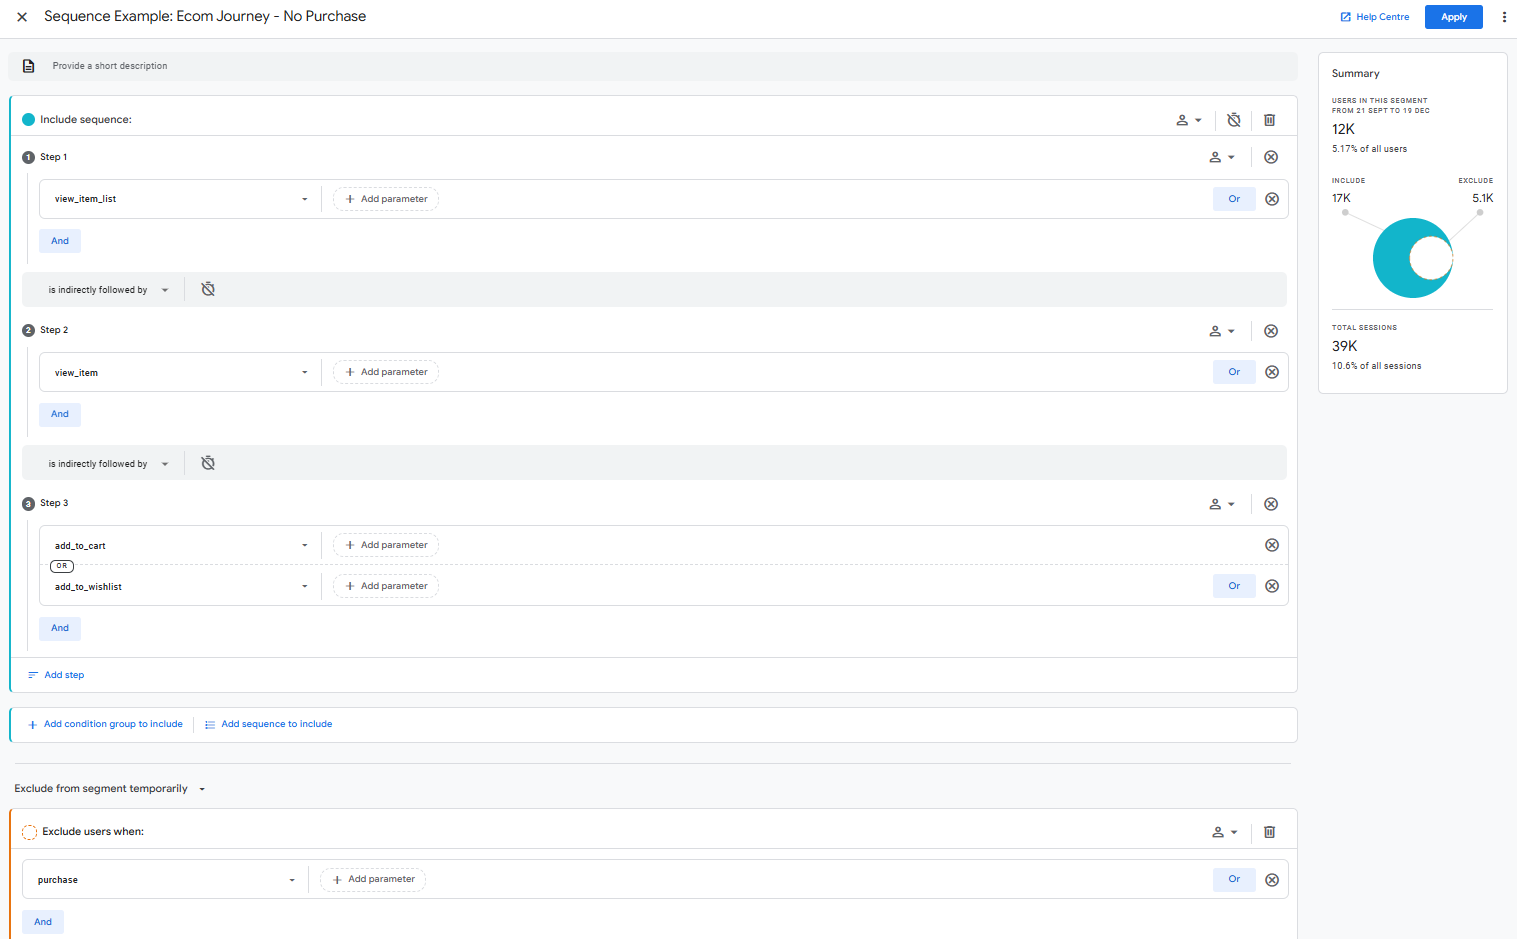
This sequencing can be either actions directly following one another, or an action that (at some point) followed another action.
Reason 5: 🌌 Another dimension
One of the biggest advantages Explorations has over Reports is that Free-Form tables are easy to build and they make it easy to pivot different data-points by. In reports you have a maximum of two dimensions with pre-existing metrics. Using Explorations, you can add many rows and columns of dimensions to create a custom pivot table. This can make dicing data together really straightforward, and allows for a lot of flexibility compared to Reporting.
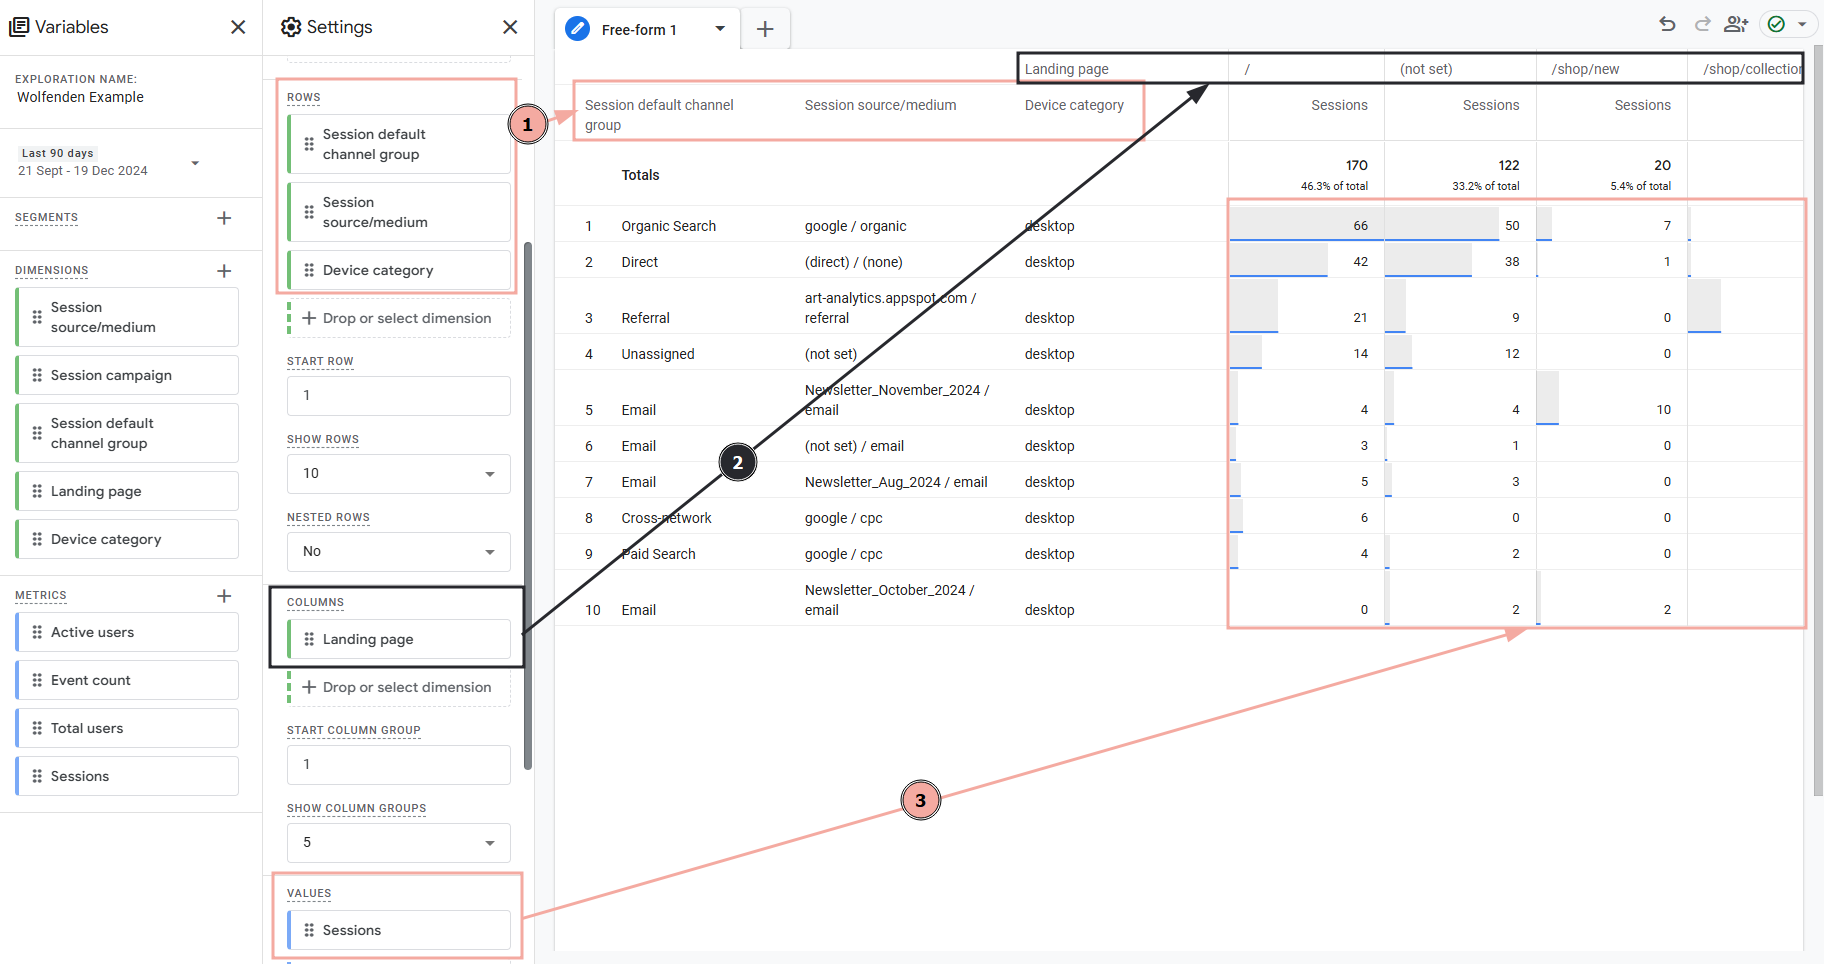
This method can also be combined with Custom Definitions or Segments for more in-depth insights.
Reason 6: 🫶 Sharing is caring
You may want to share your exploration findings with others. The good news is there are a few ways to do this.
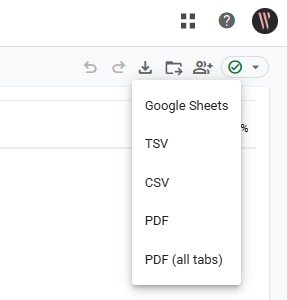
Not only are the typical export options available (using the handy Export Data button to share to Google Sheets or download as a CSV or PDF – it looks like a down button ⬇️), but you can also share explorations with other people who have access to your GA4 property. This can be done in two ways: Saving to the library or Sharing the exploration.
Saving to the library is an option available for some (currently only funnel type) Exploration types. This is the button that looks like a folder 📁. Once this Exploration is saved in the library, it can be added to a Reporting collection.
Finally you can share the exploration. This shares the exploration to anyone who has access to the property, but in read-only mode. This is the button that looks like some people: 👥.
Feeling inspired to make your own explorations?
Go ahead and start making your own explorations: you won’t break anything, and you’ll discover some brand new things about your website!
If you would like some help getting the most out of your data, please feel free to contact us.
Latest Insights From The Team.
Explore our team’s latest thoughts and actionable advice from our blog to support your digital marketing strategies.