Core Web Vitals: Understanding the New Page Experience Metrics
Update (28 April 2021): Google has postponed the rollout of Core Web Vitals till mid-June.
Page experience dates back as far as 2015 when Google started considering mobile-friendliness of sites as a ranking signal.
A year later it was joined by safe browsing and HTTPS and since 2017, pages that include intrusive interstitials are facing a threat of ranking less prominently.
In May this year, a set of three signals will be joining the above under the umbrella of Core Web Vitals, explicitly being included in search ranking.
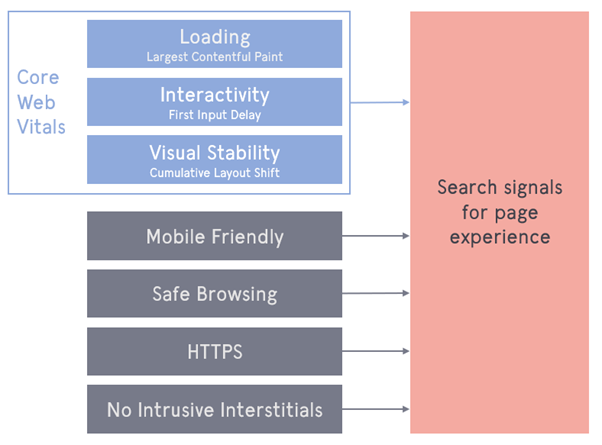
Core Web Vitals as part of the broader Search Signal for Page Experience
What are Core Web Vitals?
Core Web Vitals are essentially a measure of annoyances people might experience during the process of page loading, for example:
- Slow loading times: Or more specifically, slow loading of the main element within the visible portion of the page. For example – the hero image, heading, or initial paragraphs (Largest Contentful Paint).
- Delayed response: Elements are visible, but not responsive to interaction resulting in dead, or even rage clicks (First Input Delay).
- Page elements move: The layout of the page shifts significantly, sometimes even multiple times, while the page is loading (Visual Stability)
These have been compared to navigating an unknown city to get to an important appointment, while tripping over uneven pavement slabs, having to wait for slow automatic doors to open, and encountering detours, and confusing signs. These impede progress, can cause stress, and distract from reaching one’s destination.
Although people’s levels of frustrations might vary in both cases, Google has assigned each of the three metrics with qualitative metrics and assigning somewhat arbitrary thresholds labelled by traffic light colour-coding, which gives us a broad idea of what values we should aim for.
| Good | Needs Improvement | Poor | |
| LCP (sec) | < 2.5 | 2.5 – 4 | > 4 |
| FID (sec) | < .1 | .1 – .3 | > .3 |
| CLS (visual stability score) | < .1 | .1 – .25 | > .25 |
Table illustrating recommended values for Core Web Vital metrics.
While the first two metrics, LCP and FID are measured in familiar units – fractions of seconds, CLS is measured using a more complicated calculation, which takes into account the distance that page elements might travel during the loading cycle, as well as the share of the viewport occupied by the moving element. You can find more about the way CLS is assessed by reading the documentation on the Layout Instability Metric.
While this is useful, it is pointed out we should be aiming for the “green” values for 3 out of 4 page visits, so it leaves us with a grey (or rather brownish) area in which it is much safer to err on the side of good.
We should do this with having in mind that the better your site performs within any of the areas, the less dissatisfaction will be experienced by your visitors, as levels of frustration will be represented by a curve, rather than a drop-off.
Measuring performance
My preferred way of measuring a site’s performance was to use the desktop crawler Screaming Frog’s PageSpeed API integration – this has the advantage of being able to test pages at scale, allowing for the identification of groups of pages with similar performance issues, which allows to potentially kill flocks of birds with one stone.
There are also other ways of measuring these, such as the PageSpeed Insights web interface.
Both of these can return data which is useful, however, it’s important to remember to look at the right type of data depending on the usage case. For example, field data is great to understand your site’s current standing, but lab data might be better to look at if you have just made some changes to the site, and want to see if they’ve had an impact. Let’s look at these two data types in more detail.
Field data
Field data, also known as RUM (Real User Metrics), for this purpose is supplied by people who opted-in to data collection in Chrome, typically upon the first run of Chrome, after installation, and forms part of the Chrome User Experience Report (CrUX).
| Address | CrUX First Input Delay Time (ms) | CrUX Largest Contentful Paint Time (sec) | CrUX Cumulative Layout Shift |
| https://www.leeds.gov.uk/ | 17 | 2.918 | 0.43 |
| https://www.leeds.gov.uk/business/council-owned-land-and-property-for-sale-or-to-let | 17 | 1.360 | 0.55 |
| https://www.leeds.gov.uk/business/licensing/taxi-and-private-hire-licensing | 14 | 2.342 | 0.42 |
| https://www.leeds.gov.uk/community-hubs | 17 | 2.002 | 0.43 |
| https://www.leeds.gov.uk/coronavirus | 18 | 2.145 | 0.44 |
CrUX data retrieved for a selection of sample page from leeds.gov.uk using the Screaming Frog’s SEO Spider and the PageSpeed API
This is important to note, as people’s experience using other browsers might vary, as Chrome currently accounts for only half of the browser market.
Metrics under this banner are based on the site visitor’s experiences across the timespan of approximately one month.
This one is used for the assessment of the site which is fed into Google’s search rankings – this is the primary set of metrics you should be looking at when assessing how a site performs against the Core Web Vitals assessment at a given point in time.
Lab data
On the other hand, Lab Data is generated on demand, using assessment tools in the browser (e.g. Lighthouse), or on a 3rd party server (such as the PageSpeed Insights). These rely on setting approximating what users would see, with the elimination of confounding variables.
Lighthouse scores can be most easily gathered using Google Chrome’s Developer Console. You can run this test by pressing [F12], selecting the Lighthouse tab, making sure Performance is selected, and pressing Generate Report, which will take up to a minute to complete. Alternatively, you can use the Lighthouse web interface.
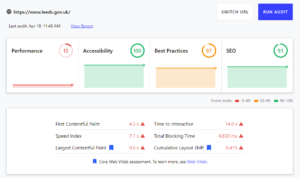
Core Web Vital metrics generated using Lighthouse for https://www.leeds.gov.uk/
This is particularly useful when comparing performance over time, for example, to judge the success of iterative improvements on a site.
Conclusion
While Core Web Vitals are likely to become an important factor for assessing the quality of pages, we encourage you not to ignore the other page experience factors – such as Safe Browsing, making sure any displayed interstitial windows are easily dismissable, the presence of HTTPS and a good mobile experience.
Good user experience extends beyond just the Page Experience factors, ultimately you should aim to help people achieve their goals easily when interacting with the site, or your organisation in general.
We’d recommend looking at other real-life behaviours using behaviour analytics tools such as Hotjar or Microsoft Clarity. While it might be time-consuming to analyse journeys, it will help with the identification of any problems people might encounter when browsing your site.
At the same time, there is more to organic search success than just user and page experience, factors also include the relevance of page content with regards to the search query, the quality of on-site content, usability, a variety of off-site signals, and much more.
You will still be likely to rank well for your brand terms, even if you might not quite meet Google’s Core Web Vitals guidelines.
Ultimately, being successful in organic search entails being able to successfully compete in the environment of the wider search results, meaning that the competitive landscape is a factor that can’t be ignored.
If your competitors are technically-minded and aware of the developments in the search industry, it’s likely that they are already working on improving their sites – this is typically the case in highly competitive industries such as healthcare, legal, and financial services.
Don’t know where to start? Get in touch with us for an initial audit for your site.
Latest Insights From The Team.
Explore our team’s latest thoughts and actionable advice from our blog to support your digital marketing strategies.